Every day we produce huge amounts of data that can be used by apps and other services. Personal finances, fitness apps, home control & automation, work loggers… There is an app for pretty much everything we can think of.
Some applications that we use every day allow us to export data as a CSV file. This is great because it means we can explore data with a finer detail and eventually get better insights than those that most applications give by default.
All we need is a proper Data Visualization tool that can take these CSV files and lets us play a bit with the data.
So, let me show you how Viur works with CSV data.
For this example I’ve chosen a dataset from SpritMonitor that contains my car’s mileage and my Gas’ expenses.
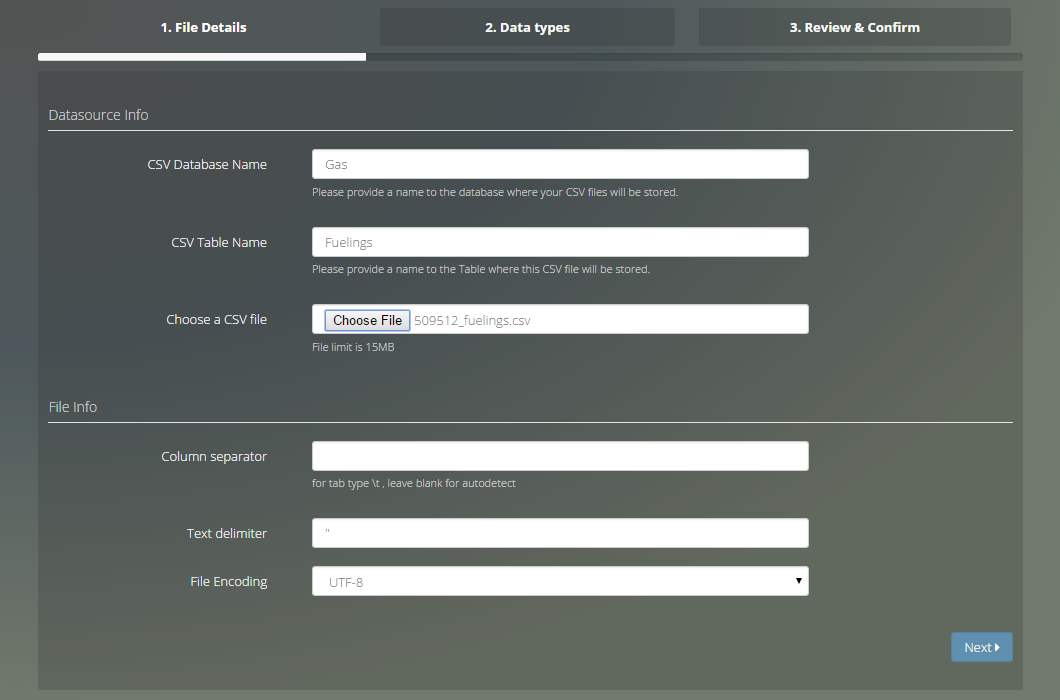
On the Datasouce Configuration page let’s choose “Files”
The first thing to notice is that we have to fill in a “CSV Database Name” and the “CSV Table Name”. This is related to how Viur handles CSV files:
Viur uploads the data from the file into a private cloud database that only the user (and team) has access to. When uploading the second file you can put it into the same database and on a separate table, so when querying you can perform joins.
While filling the form, pay attention to the column separator, and file encoding. Please note that files exported in Microsoft Excel may have the encoding set to Windows-1250.
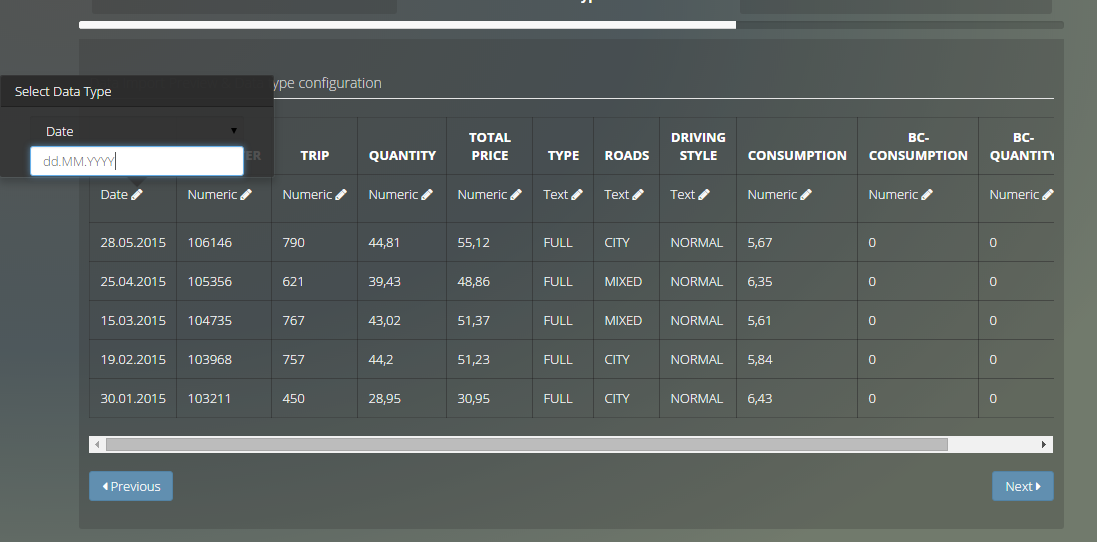
On the second step change the data types for each column. This is crucial to perform relevant data analysis!
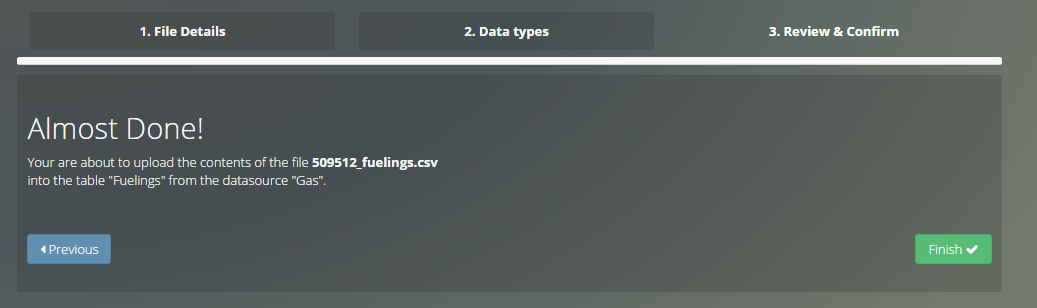
The last step is just a confirmation, go ahead and hit Finish!
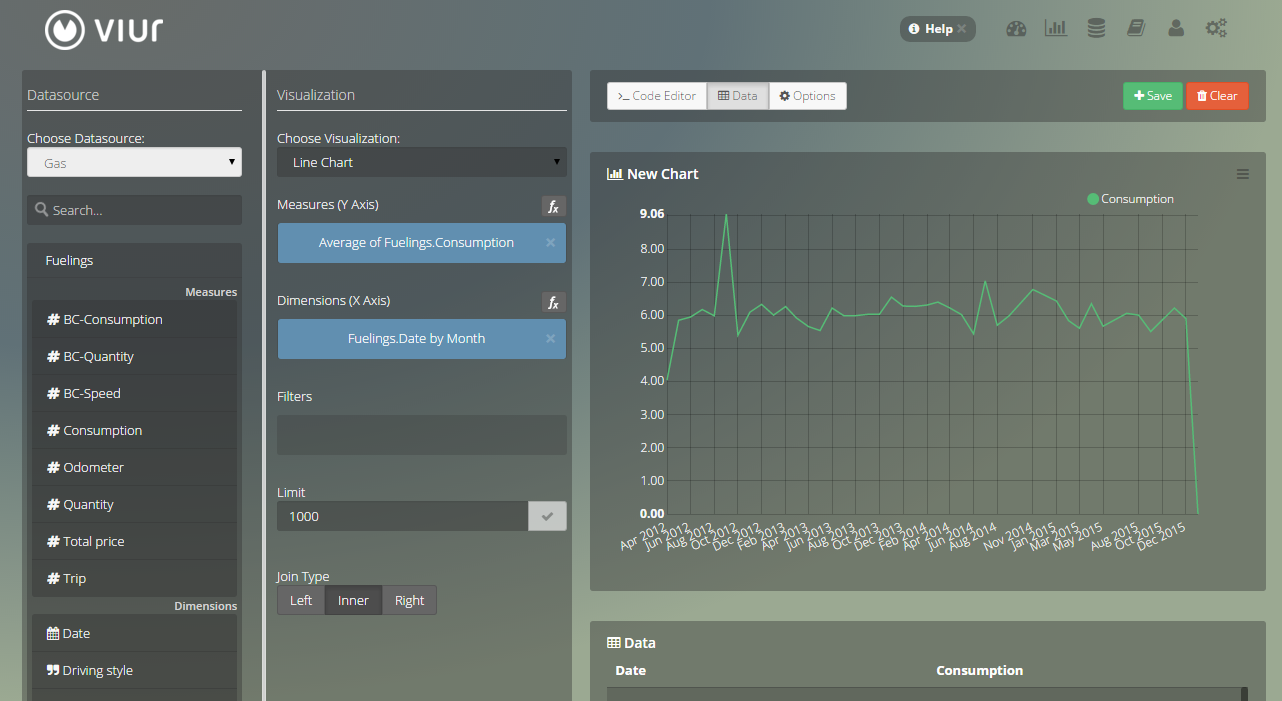
We’re now ready to explore the data and create some widgets on the Widget Creator page.
Choosing the datasource that we’ve just created and dragging the Consumption in the measures and applying an Average we’ll show us the total consumption average.
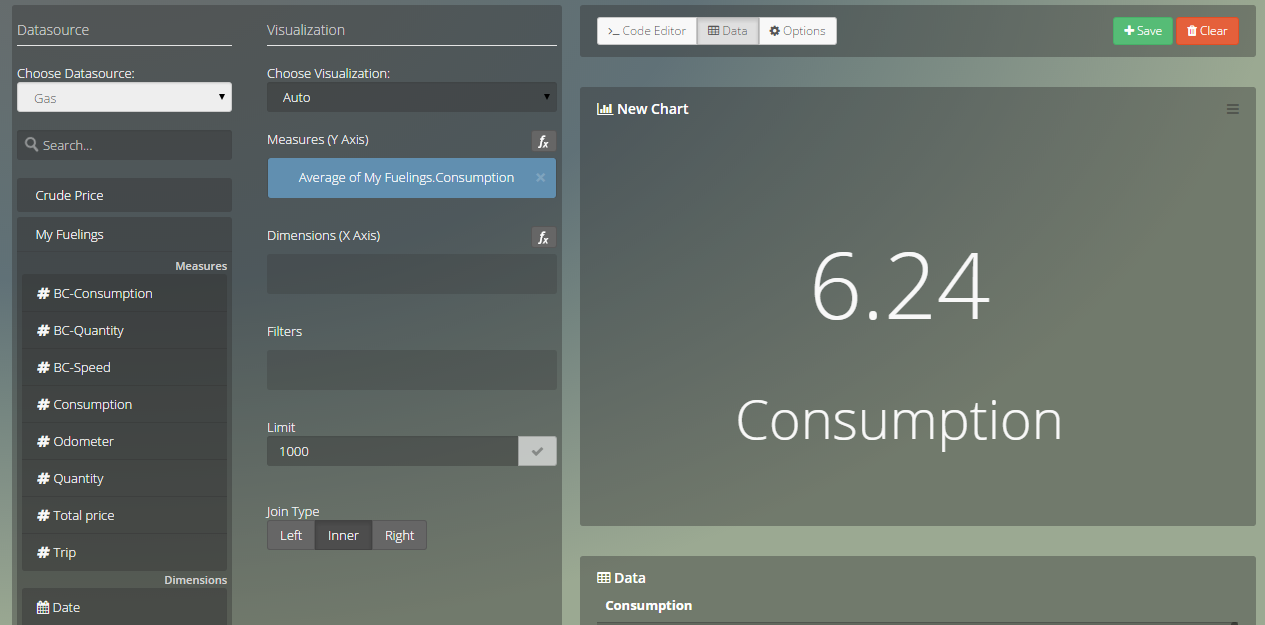 6.24 liters per Kilometer (about 45 miles per gallon in imperial units). Not a bad result for urban driving in such a hilly city.
We can go further and drag the Date. This is quite interesting because the season (cooling or heating) might have an impact on the consumption. I have to get weather data and cross these values with the temperature to see if there is a pattern. If you are asking yourselves what’s that huge spike in September 2012, let me just say that I decided to check the car’s top speed…
This was just a small tutorial on how to start analysing data from a CSV file. On a next blog post, I’ll go deeper on data analysis, this time using multiple CSV files.
Viur is Business Intelligence made easy.