In a global market where competition is tight, you must make sure your customers are happy.
There are many ways to measure customer satisfaction, and we found one that is quick to implement, uses a platform that almost every site uses and is free. It even works with Net Promoter Score if you want, as we explain below.
In order to put this example in practice, you must have Google Analytics on your site. You can learn here how to set it up.
Without further ado this is how we did it:
Where we wanted to know if the user liked something we placed some thumbs up and thumbs down buttons.

Whenever the user clicks one of the thumbs a javascript function sends the corresponding value (0 if the feedback is negative or 1 if positive).
<!-- html code -->
 <p>Was this information useful?
 <i onclick="giveFeedback(0)" class="btn-feedback fa fa-thumbs-o-down text-danger" ></i>
 <i onclick="giveFeedback(1)" class="btn-feedback fa fa-thumbs-o-up text-success" ></i>
</p>
To have the thumb icons with colors you'll have to use a CSS toolkit like Font Awesome (used in this example) or Bootstrap and include this snippet on your css file:
/* css code */
 .btn-feedback {
    cursor: pointer;
}

.text-danger {
    color: #e5603b;
}

.text-success {
    color: #56bc76;
}
Google says events should be invoked like this:
ga('send', 'event', 'category', 'action', 'label', value);
//if you are not using Universal analytics yet it's
_gaq.push(['_trackEvent', 'category', 'action', 'label',value]);
So we can make our _giveFeedback _function like this:
function giveFeedback(value) {
  ga('send', 'event', 'button', 'feedback','feedbackPage.html', value);
  //if you are not using universal analytics use instead:
  //_gaq.push([‘_trackEvent’, 'button', 'feedback', 'feedbackPage.html', value]);
}
As you see the value variable depends on the user’s input.
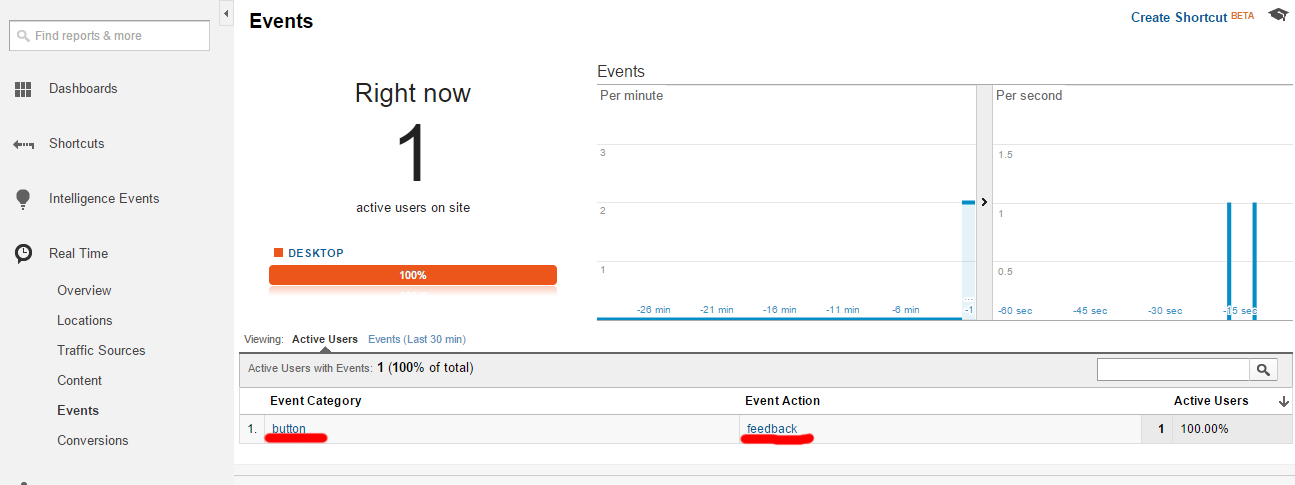
With this small piece of code set up you can test if everything is working by going to Google Analytics > _Realtime _> _Events _and see if the events appear like this as you click the thumbs:
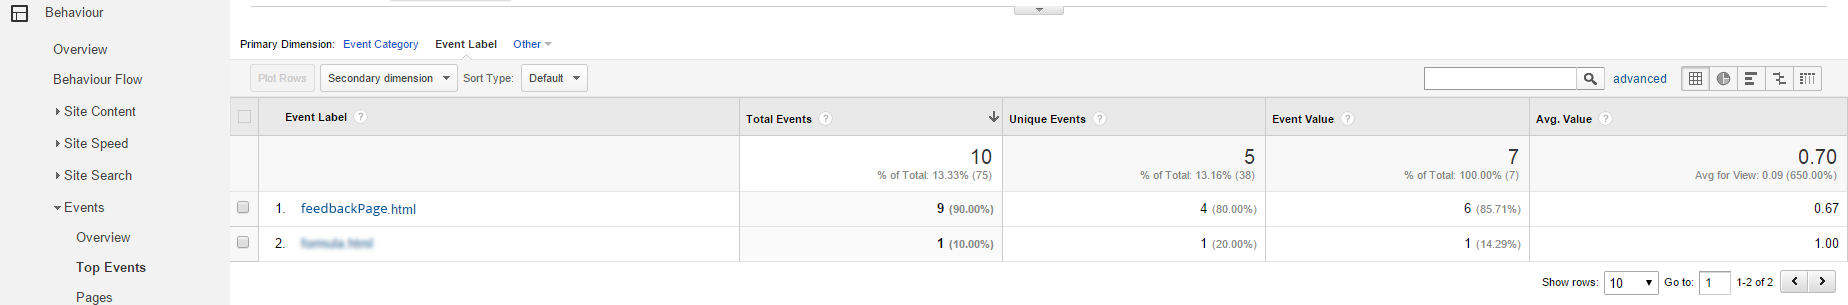
If everything is ok, results will appear later in Google Analytics under this event’s “Avg. Value”.
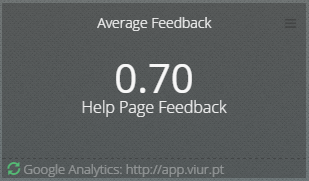
If you want a prettier and more awesome way to track this, you can use Viur to create a widget for it:
To accomplish this just go to the Widget Creator, choose Google Analytics as a Datasource and from “Event Tracking” drag “Avg. Value” to the measures, and add “Event Action” to filters.
Protip: Viur has a search input under the datasources dropdown (see the picture below). Search for “event” for a faster lookup.
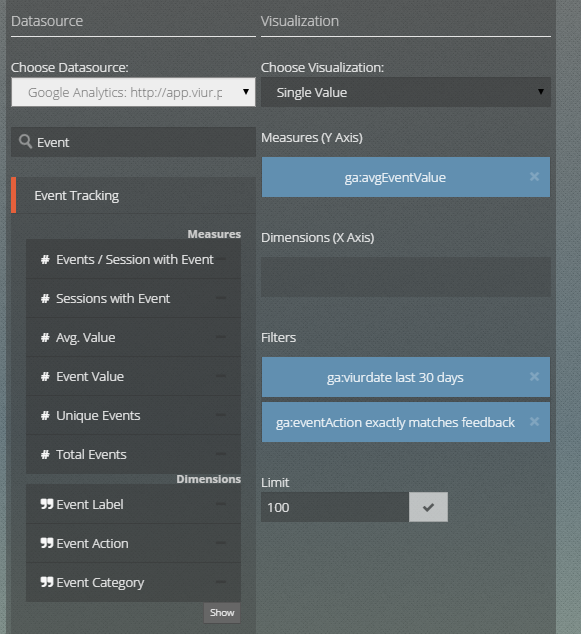
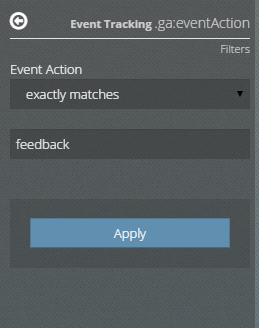
Click on the filter you’ve just dragged to open the Filters panel and choose “exactly matches” to “feedback”:
Save the widget and add it to the dashboard and you’re good to go.
In this example, we just used a simple binary (0,1) feedback system. However, you can easily use the Net Promoter Score, just change the question a bit and pass values from 0 to 10 to Google Analytics.

That’s it, we hope you found it useful for knowing what your users think of your product.
Don’t hesitate to drop us a line about this post or Viur.