Using Viur to create useful KPIs
If you already use Viur you know that it connects to all kinds of data sources enabling you to unlock the value of stored data without needing to be a data scientist or a developer.
For those who don’t know us yet, we offer an analytical platform that connects with your business data (cloud and on-premises) allowing you to visualize and explore that data.
So, with this in mind, we would like to show you how to create some sales KPIs (key performance indicators) using our demo database. For this demo, we chose to use the Northwind database that exemplifies a typical relational model for a store with orders, products, clients, suppliers, employees etc.
Viur’s interface uses the data warehouse nomenclature so as a quick refresh:
A Measure is a property on which calculations (e.g., sum, count, average, minimum, maximum) can be made.
Dimensions provide structured labeling information to otherwise unordered numeric measures. The dimension is a data set composed of individual, non-overlapping data elements. The primary functions of dimensions are threefold: to provide filtering, grouping, and labelling.
in Wikipedia
So without further ado let’s build some KPIs just by dragging a few blocks and applying simple modifiers.
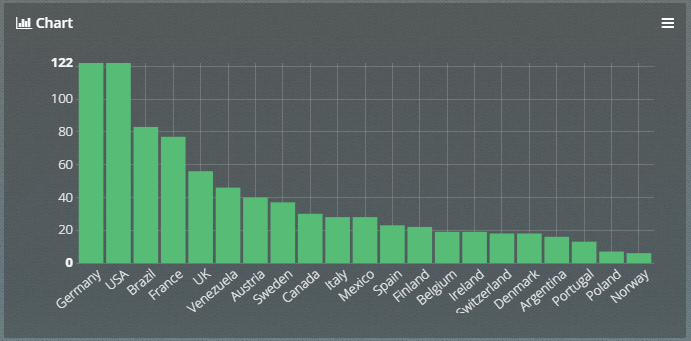
KPI 1 - Orders per country
To know where are your clients are.
Metrics: Count of Orders.”Order Id” sorted descending
Dimensions: Orders.ShipCountry
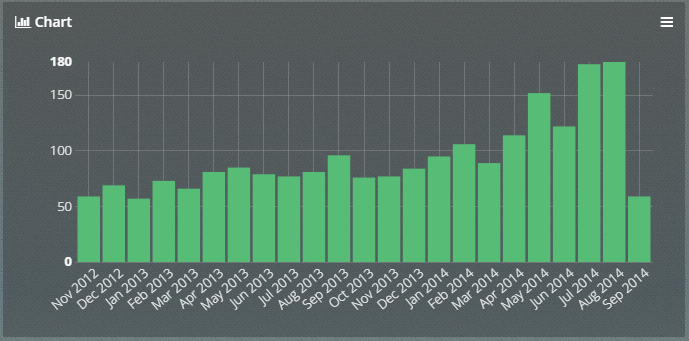
KPI 2 - Order volume
See if you are getting more orders over time.
Metrics: Count of Invoices."Order Id"
Dimensions: "Order Date" grouped by month
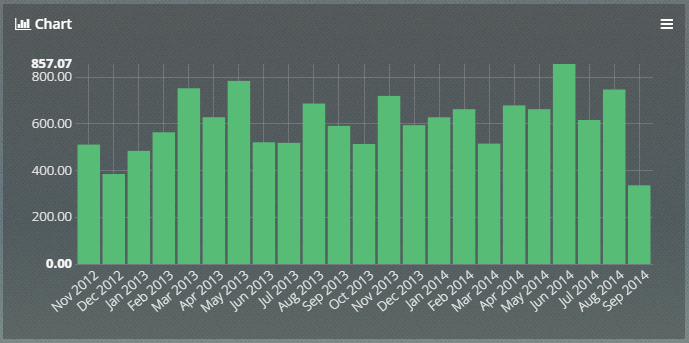
KPI 3 - Average order value
This is a useful KPI because it shows you if your customers are spending more.
Metrics: Average of Invoices."Extended Price"
Dimensions: "Order Date" grouped by Month
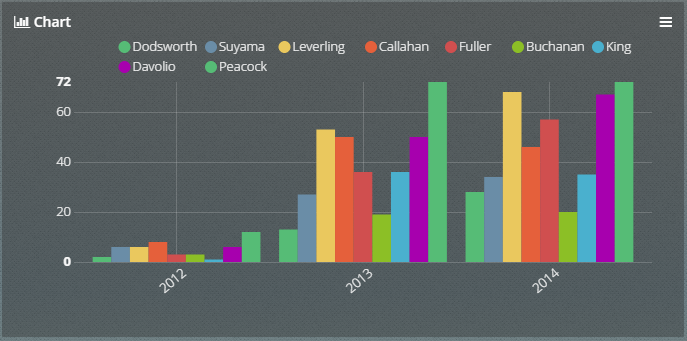
KPI 4 - Employee’s dispatched orders
Compare employee’s productivity
Metrics: Count of Orders."Order ID"
Dimensions: "Order Date" grouped by year and Employees.Last Name
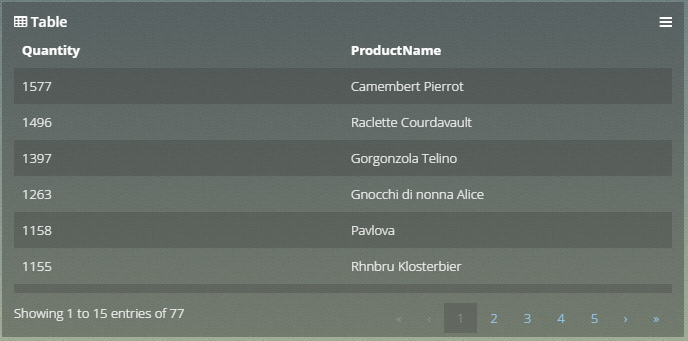
KPI 5 - Top products
Find which are your top selling products
Metrics: Order Details.Quantity sort Descending
Dimensions: Products."Product Name"
So that’s it for now, we hope this post was useful to show how to do business analytics KPIs by exploring a conventional database without any SQL code.
Don’t forget to follow us on social networks to view more content like this.
If you have any doubt please contact us or go to www.viurdata.com .