We live in an increasingly data-driven society. Data has become a word that consumers and the public are increasingly aware of, but it’s also something that can help business owners and managers improve and grow their organisations. Big Data, Analytics and Business Intelligence have become buzzwords these days, and many businesses know they need to have them, but they don’t know why, what to do with them, or what are the right questions to ask.
Data comes in many forms and from many sources, so it’s good to have a one-stop shop to view and analyse it. This is where Business Intelligence dashboards come in. Dashboards are more than a buzzword though, and if you’re asking yourself whether your business or organisation needs a dashboard, then the answer is most likely Yes.
This is where Viur comes to help you make the most of your data and get ahead of the competition.
Business Intelligence tools can benefit businesses and organisations, from sole-traders and small family-run setups, to startups, right through to global multinationals and enterprises. However, understanding data can be difficult, so it’s good to have an easy to use data visualisation solution to display the metrics and key performance indicators - or KPIs. The more data and data sources you have, the more confusing it can become to view and understand, so a solution such as Viur will provide this data visualisation in a simple, clean and effective way that you can customise and understand. You’ll gain key advantages over the competition, save time, reduce your stress levels, and increase your sales and profits, while getting a more in-depth understanding into your own operations and into customer behaviour and needs.
What exactly is a dashboard?
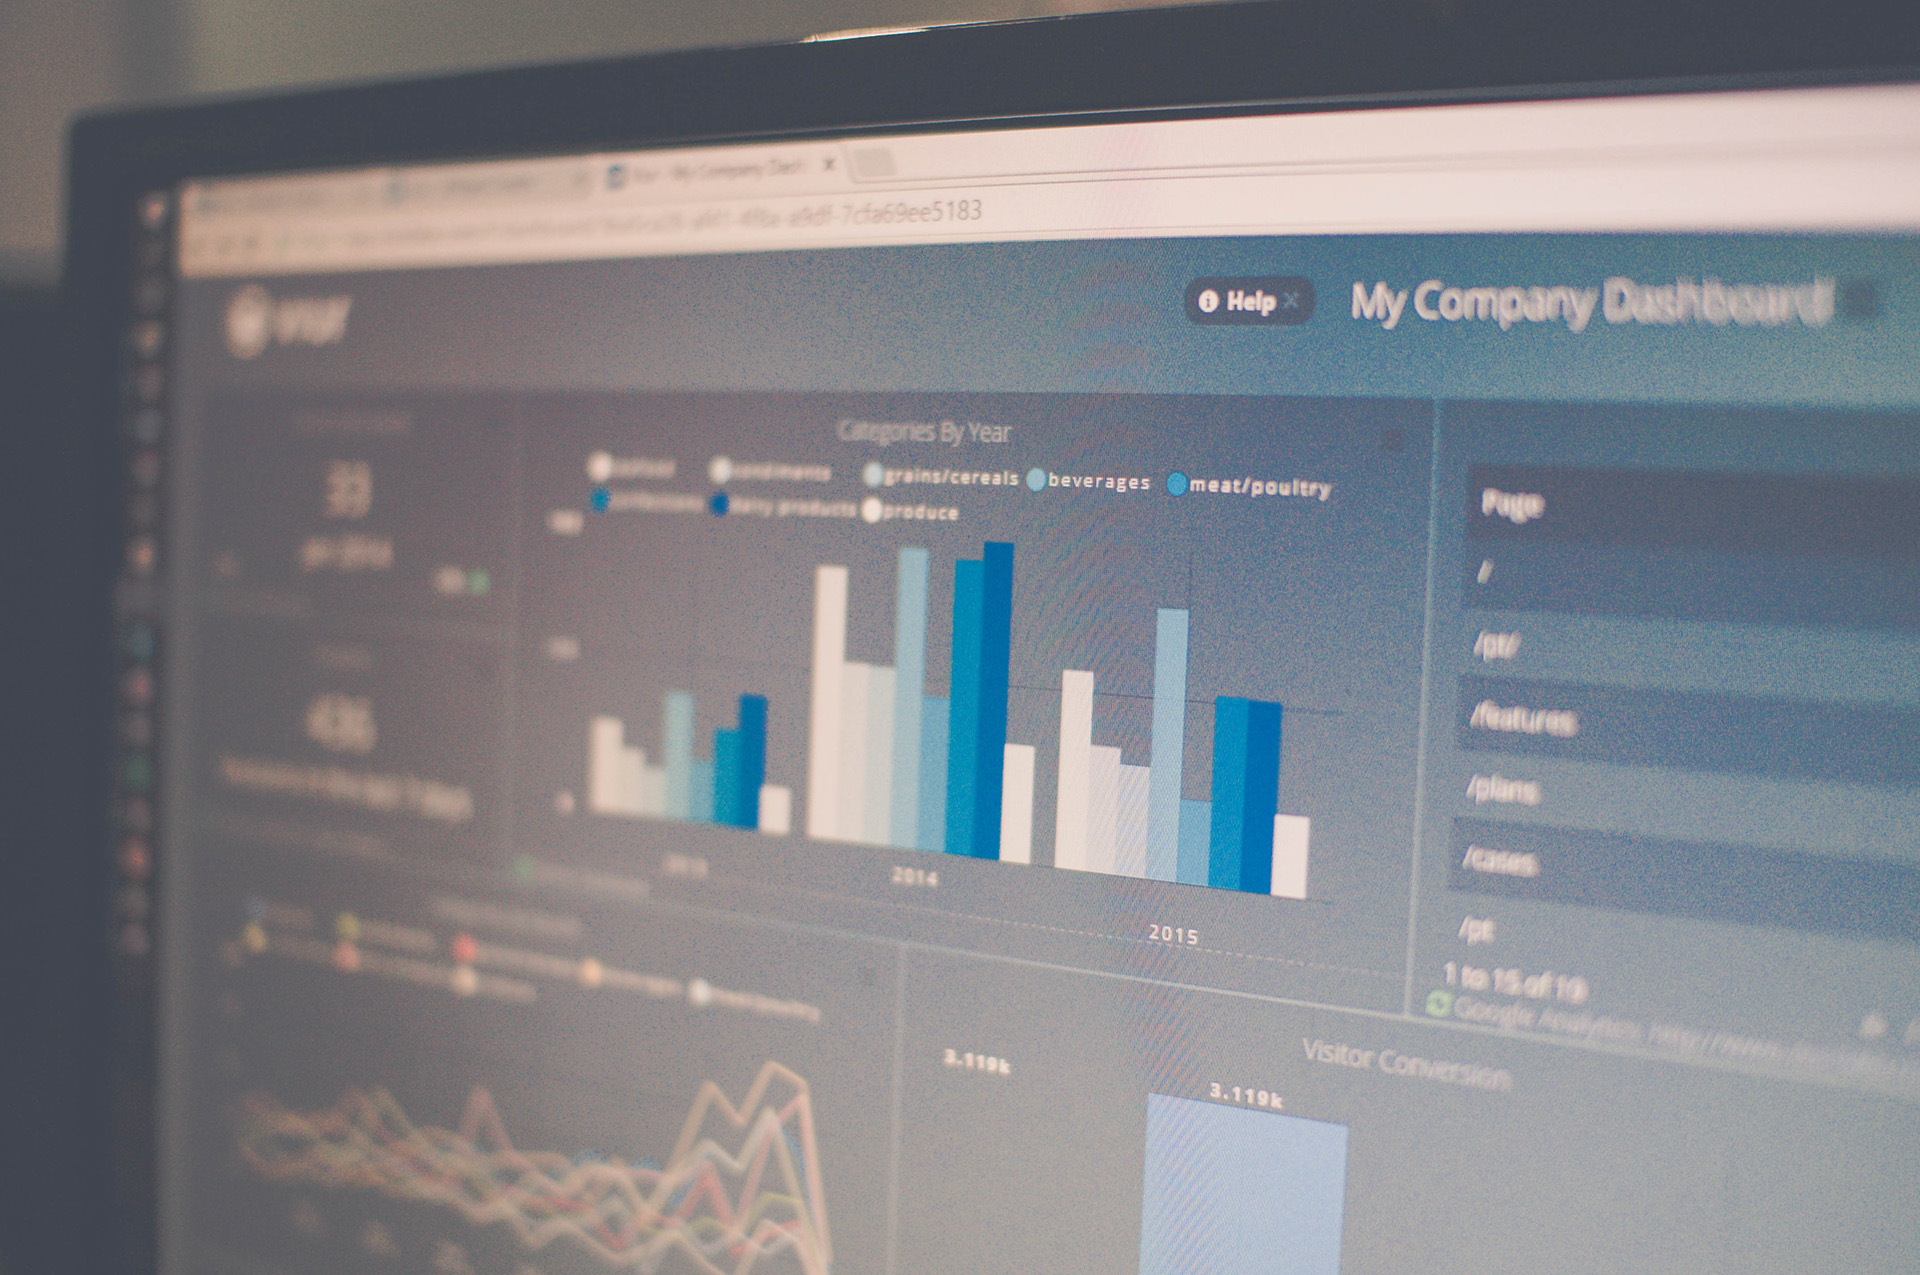
A business intelligence - or BI - dashboard offers a series of charts and graphs showing what’s going on in your business, ranging from sales to user behaviour, the results of an email campaign, to simply monitoring and managing stock.
In layman terms, a good analogy would be the dashboard of your car. It provides the driver with key information about his or her vehicle. Think about it. Without a quick glance to that visual data on even the most basic dashboard you wouldn’t know your speed, fuel supply, oil temperature, or even if your headlights are on or off. The dashboards in our cars have been around for as long as we can remember and we pretty much take these things for granted, but without the visualised data we could end up in real trouble on the roads. The way business is going and how data and metrics are being analysed, it won’t be long before any business that doesn't invest in a dashboard could be in real trouble; just as you would be if your car dashboard didn’t tell you you’re about to run out of fuel!
Your BI dashboard offers a visualisation of the metrics and KPIs related to your business through the various data sources you associate to it. These visualisations help you to understand your customers better, their patterns, how they use your service and products, and their general relationship with you. It can help you set performance goals and can even help to anticipate future patterns or problems before they arise. BI dashboards aggregate, consolidate and arrange the numbers, metrics and performance on a single screen.
A good BI solution like Viur includes an easily customisable interface that can be tailored to specific clients’ custom needs, displaying metrics targeted for even a single perspective or department. Viur connects to your databases, cloud services and files, and in just seconds you can start to explore your business data with simple drag and drop or with SQL queries. It enables you to put your important charts and metrics in a dashboard, and with one glance share an array of important insights with your team or with the whole world.
More than one type of dashboard
Typically, businesses use two basic types of dashboards with each fulfilling a specific purpose: analytical dashboards and operational dashboards.
Analytical dashboards
Analytical dashboards help business owners, executives, C-level and senior personnel determine future goals through insights collected over time, such as on a weekly, monthly, quarterly or annual basis. It can help them to understand what happened and why, providing the information to make the decisions to make change.
Operational dashboards
Operational dashboards are often used on a departmental level, helping customer-facing employees to monitor KPIs and other performance-related metrics, even down to inventory levels. This type of dashboard offers live information, allowing operational issues to be spotted and resolved as or before they happen.
How can a Viur dashboard help you?
Objective data offers a clear view of your business
Viur’s Dashboards have a clear user interface, helping you to very easily understand and evaluate potentially complex data through simple graphs and charts. It can be hard to make sense of the volume of data available to us, or even to know exactly what data you need to collect. Working with several data sources can be confusing, and it can be hard to use the data in any meaningful and useful way. If you’re going to effort of collecting these metrics, you should get the most of them. Viur helps you sort through all your data sources so you know exactly what’s happening in your business. What have you been doing that’s working, and what’s having no effect on customers or would-be customers. Are they repeat business? Maybe more pertinently, if they’re not, why not?
Content today is increasingly visual, and your data should be too. Wouldn’t it be great to have a clean way to automatically collect all the data into one convenient visual dashboard rather than skipping between platforms and getting confused? Viur cuts through the noise, accessing and analysing the facts in a clear manner to allow you to view it in real-time and to understand your data easily, leading to improved decision-making to benefit your business.
The Value of leveraging the right data
Along with its people, product or service, data is possibly of the most valuable asset any business has in today’s environment. Now that you’re collecting the data you think is meaningful, what to do with it? Many business owners and managers have a repository of data and metrics available to them, but don’t understand it or how best to leverage it. The right dashboard helps you overcome these challenges, as understanding it and leveraging your data can be expensive and time-consuming. A well-designed and easily customisable dashboard from Viur makes it easy to gain and understand those insights you need to help improve performance, product and service.
GoDaddy founder Bob Parsons once said, “Measure everything of significance. Anything that is measured and watched, improves.” Once you know what to watch and how to interpret it, it’s so easy to discuss and adjust your thinking to improve results. If you see a problem, you can fix it. And as Viur is mobile-ready, you can even check out your KPIs on the go.
Consolidation of data
A Viur dashboard provides real-time data analytics on one platform, saving you the frustration and hassle of switching between screens and databases, and logging on to several analytics platforms at once, losing track and getting confused as you do so. There are many BI products on the market, but many require IT expertise or specialised training just to get started, and so scare off potential users. Viur is easy to get into, but we realise that not everyone has the same level of expertise and experience we have, so we’re happy to provide personal support and help if you need it to get going.
Viur works with data from multiple sources to create a single view point, and already works seamlessly with MySQL, SQL Server, PostgreSQL, Heroku Postgres, Facebook, Google Analytics, Amazon Redshift and CSV Files, with that source-base growing steadily. Your data stays with you, not with Viur. We connect directly to your data sources, and all connections are encrypted using the safest standards, meaning confidential information remains confidential.
Get value for money and improve your business performance
The price point in business intelligence dashboards can be one of the most off-putting aspects, especially when trying to fully understand the usability and ease of a platform. Meanwhile more time and money is wasted as you fight with spreadsheets, trying to create in days or weeks what Viur can do for you in just a matter of minutes.
From your provided metrics sources, Viur offers businesses and organisations easily understood, objective performance details, offering the basis for making the right decisions to grow your business. They help in understanding customer behaviour and into making informed and intelligent decisions. A Viur Dashboard aggregates relevant metrics from all your sources, and it can be customised to be opened or restricted to particular team members, departments and partners in a clear and understandable manner.
A good dashboard will not only display historical and real-time data, but will offer the user insights into both the positive and negative business performance, and show potential problems and difficulties, allowing the relevant personnel to pre-empt and tackle new challenges proactively. It’s well established that business owners and managers with an understanding of their dashboard make better decisions for their business or organisation, knowing exactly where to focus time to increase results. Knowledge is power, so the knowledge of what’s working in your business is a very powerful and deceptively simple tool to increase sales and profits.
The big picture
The Viur dashboard provides a complete overview of your most important metrics, showing the big picture of your business. Having the right data available on-demand on your dashboard keeps you informed, relevant and competitive, offering a key advantage over your competitors by keeping one step ahead of them.
Sign up for a 21-day, no-ties free trial today, and discover the advantages Viur can bring to your business.