If you manage a Facebook page and you like to see how people are engaging with your content you’re probably a big fan of the Facebook Page Insights. It allows you, among other things to:
- View metrics about your Page's performance
- Learn which posts have the most engagement
- See data about when your audience is on Facebook
One of the most useful metrics over there is the Engagement Rate that in a certain way allows you to see how popular or viral a post was.
According to their help center the Engagement Rate is:
The number of people your post reached who then liked, commented, shared or clicked on your post.
If you do a quick google search you’ll find different ways to calculate Engagement Rate being the most common one, and the one that sticks more with the Facebook definition:
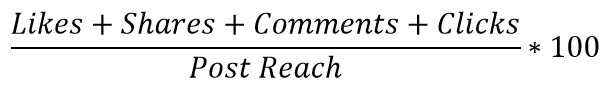
fig. 1 - engagement rate formula
But if you go to your Page Insights and apply that formula to the data you retrieve from there your results don’t match the Engagement Rate.
For example, take a look at one of our post data:
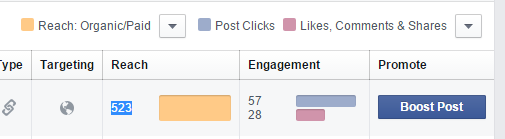
fig. 2 - 57 Post Clicks + 28 Likes, comments, and shares
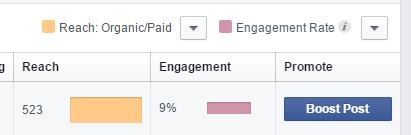
fig. 3 - 9% engagement rate
Putting these values into the formula you get:
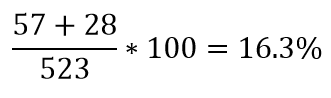
fig. 4 - putting the values in the formula
But 16.3% is quite different from the 9% they show on the page insights, so what’s wrong?
What we found is that Facebook calculates Engagement Rate using other variables that are available in their Graph API. The formula that we use at Viur, and that matches Facebook results is the following:
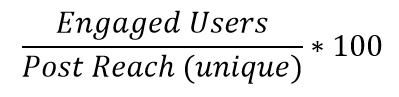
fig. 5 - the real formula!
Engaged Users is “the number of people who clicked anywhere in your posts” (postengagedusers in the Graph API )
Post Reach is the “The number of people who saw your Page post” ( postimpressionsunique in the Graph API)
With this formula we can get to the same results that Facebook (except we use decimal places in our results)
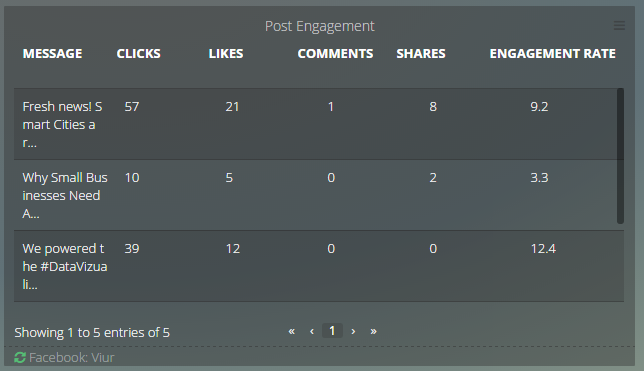
fig. 6 - the correct values!
We hope this post clarified your understanding about the Engagement Rate and its calculation. Shoot us an email if you have any questions, we always answer!
You can use Viur to have your Facebook Insights in a pretty dashboard side by side with your Google Analytics data and control your web and social presence. And if you are running an eCommerce you can connect your database to Viur and see if your business is taking off!